
A well-formatted financial model does more than calculate numbers; it communicates insights with clarity and consistency. By applying precise cell referencing, thoughtful visual cues, logical page layouts, print-ready settings, and strong structural conventions, modelers can turn raw spreadsheets into polished, decision-ready tools. This guide walks through each of these formatting pillars in sequence, showing how they connect to preserve the model’s integrity on-screen, in print, and during review.
1. Structural Tips
When building a financial model, attention to detail is especially important in its structure. Following clear structural practices helps maintain consistency and accuracy, enhances the user experience, and ultimately supports the model’s success.
- Never enter the same variable twice within the model. A second instance should always link back to the original input cell to maintain consistency and ease of updates.
- Never hardcode values within formulas (e.g., =A5 + B5 + 29.832). Instead, enter hardcoded values into dedicated input cells and reference those cells in formulas to enhance transparency and flexibility.
- Do not insert blank columns between years for spacing. If you need more space, widen the columns. If you need to add calculated growth rates, place them on a separate row instead of adding columns that disrupt model flow.
- Use circularity sparingly and only if absolutely necessary. Ensure you have an excellent grasp of how to build, manage, and debug circular references before implementing them in your models.
- Minimize or avoid the use of macros unless essential. Macros can be useful for tasks such as creating summary pages that pull results across multiple cases, but should not be used if simpler methods can achieve the same outcome.
- Use a manageable number of worksheets, ideally between 5 to 10. This keeps your model organized and easier to navigate without sacrificing clarity.
- Keep all assumptions up front in a dedicated section or sheet to enable clear understanding of the drivers behind your model.
- Type the company name only once and link every other instance within the model back to this original cell to maintain consistency and reduce potential for errors.
2. Absolute References
The ability to create formulas with absolute references is important when manipulating data and building financial models. By default, Excel uses relative referencing, but using absolute references allows you to “lock” a reference to a particular cell, row or column by inserting dollar signs in front of the row reference, the column reference or both.
Financial models include key assumptions such as interest rates, growth rates, or inflation rates. Absolute references allow you to lock these assumption values so that they remain constant throughout the model. As you update these assumptions in one place, the changes will propagate consistently throughout the entire model.
There are 4 types of references:
- Relative Reference (no lock)
- Partial Absolute Reference (column lock)
- Partial Absolute Reference (row lock)
- Absolute Reference (locked)
Relative Reference: A1
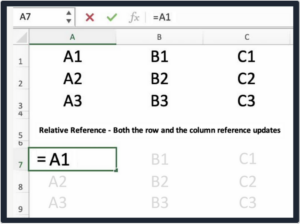
In the image above, note how the cell references look identical to the references above since both the column and row are relative. The copied cell is highlighted.
Partial Absolute Reference (column lock): $A1
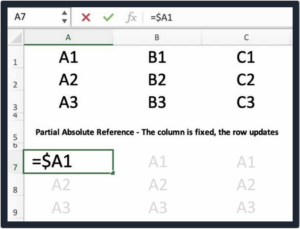
In the image above, note how the column reference doesn't update but the row value is updated. The copied cell is highlighted.
Partial Absolute Reference (row lock): A$1

In the image above, note how the column reference is updated but the row value doesn’t update. The copied cell is highlighted.
Absolute Reference: $A$1

In the image above, note how neither the column nor row updates when the cell is updated. The copied cell is highlighted.
3. Conditional Formatting
- Conditional Formatting applies formatting to cells that meet pre-specified criteria.
- Conditional Formatting makes it easy to highlight interesting cells or ranges of cells and emphasize important outlier values.
- If you have more than one rule, the first rule will take priority over the second rule, so it’s important to enter the rules in the appropriate order.
- Conditional formatting only allows you to change font style, underline, color, and strike-through as well as borders and shading. You cannot change the font or the font size.
- Excel provides a number of built-in formatting rules which allow a user to format based on predefined tests (such as top or bottom ranked values, etc.).
- Using a formula to apply conditional formatting gives additional flexibility.
4. Headers & Footers
File Path
Include the file path on every page, typically the bottom left or right corner. This is so people can find or update the correct version.
Page Numbers
Include page numbers on every page, typically the bottom center. This helps when presenting the model and makes it feel like a presentation.
Date & Time
Include a date and time stamp on every page (typically the bottom left or right corner). This ensures people are all reviewing the same version of the model.
Scenario Tag
Incorporate a Scenario Tag on every page that displays the case being run - this is simply a label that explains to the reader which set of assumptions are being run.
Now that headers and footers frame your sheets, ensure your model also looks great and reads correctly when printed.
5. Printing Financial Models
Print-friendly models serve as powerful communication tools, facilitating better understanding and decision-making among diverse audiences.
Enhanced Readability for Decision Makers
A printed or PDF version of the model allows for easy and quick review, especially in boardroom settings or during presentations.
Improved Communication
Printing a model encourages the modeler to focus on clear, concise, and logical presentation of data and assumptions, making the model easier to and follow.
Model Printability Promotes Better Design
Even if a model is never printed, considering its printability during the design phase can lead to a more organized and user-friendly electronic version.
Technical Benefits
Optimizing a financial model for printing ensures consistent print ranges and easy navigation across pages, minimizing margins, and using headers and footers effectively as this can enhance the clarity and professionalism of the model.
A good financial model must also work on paper or as a PDF. The vast majority of decision makers today are still making decisions while looking at a document on paper or reviewing the model as a PDF on their screen.
Most senior executives won’t be clicking their way through a spreadsheet file and playing with the formulas. They want to see something that looks and feels like a presentation. That means all financial models need to be powerful communication tools.
In other words, it is not enough to just present facts and figures. The model needs to tell a story that will grab the attention of those looking at it and then give them the information they need to make an optimal business decision.
To optimize the printing of a model:
1. Set up the model in print-size pages
- Approximately 8 to 10 columns of numbers with row labels
- Approximately 35 to 50 rows with page titles
2. Page Layout Tab (Alt P S P) - Expand Page Setup Menu - Page Tab
- Set to Landscape
- Scaling should be 85% to 95%
3. Page Layout Tab - Expand Page Setup Menu - Margins Tab
- Minimize the margins: .25” to .4”
- Click the option to centre on page horizontally
4. Page Layout Tab - Expand Page Setup Menu - Header/Footer Tab
- Click Custom Footer and click on the [Page] and [Pages] buttons
- Can also use the date, time, and file path buttons
5. Page Layout Tab - Expand Page Setup Menu - Sheet Tab
- This is the key technique to maintain consistent print ranges that do not have to constantly be reset.
- In the Sheet box, enter each page range, separated by commas
- Each page on the model should be separated by at least one blank row
Formatting is the framework that elevates your model from a calculation engine to a compelling narrative. By enforcing clean structural conventions, anchoring key inputs, spotlighting important data, framing sheets with precise headers and footers, and applying practical printing techniques, you will deliver financial models that compute accurately and communicate with professional polish on screen, in PDF, and in print.